Strategic & investment oversight
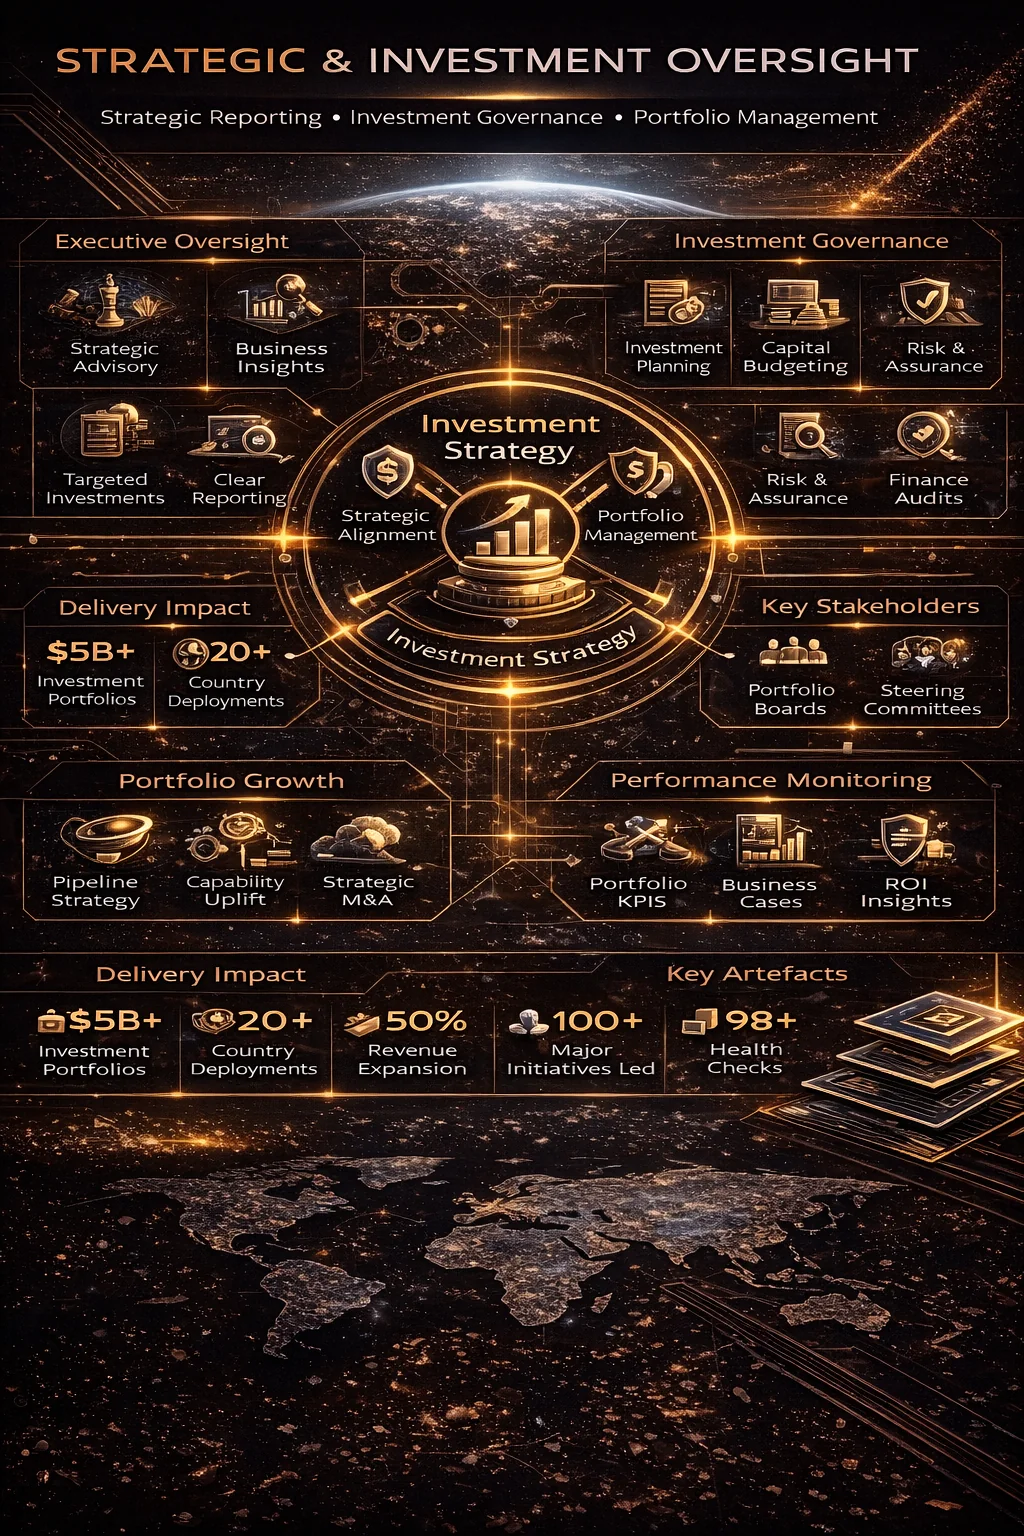
Representative outcomes across investment oversight, enterprise portfolio governance, and multinational transformation delivery in regulated and complex institutional environments.
Representative KPI signals
Positioning
This domain demonstrates how scale, governance, and disciplined oversight convert large portfolios into controlled execution rather than uncontrolled spend.
Capability evidence
Origin
NATO / NCIA-related environments · United Nations system programs · IBM enterprise architecture initiatives · Telecom transformation programs (Nokia · Alcatel · Motorola)
Representative example
Enterprise-scale architecture, security, cloud and transformation governance supporting mission‑critical institutional digital platforms and multinational transformation programs.
Representative scope
- Capital planning and investment oversight models
- Program portfolio governance and sequencing
- Benefits tracking, delivery risk visibility and executive reporting
- Coordination across institutional, vendor and stakeholder layers
Operational signals
- Investment governance across large digital and infrastructure portfolios
- Executive visibility for prioritisation, sequencing and benefits realisation
- Program-level control points supporting accountability and institutional confidence
- Portfolio governance adapted to constrained and high-trust environments
Typical deliverables
- Investment governance packs and executive reporting
- Program portfolio dashboards and prioritisation views
- Governance cadence, decision logs and benefit realisation tracking
- Oversight briefings for steering committees and senior leadership
Sector applicability
- International organizations
- Government and public administration
- Regulated digital programs
- Infrastructure and institutional modernization
Named programmes behind the figures
Figures as recorded on named engagements — each one is listed on the Projects page.
How investment oversight is run
- Options before solutions. Business case with at least three options, including doing less.
- Full cost, not purchase price. TCO and ROI over the asset life, including run and exit costs.
- Funding that fits. Budget, EU funds or IFI loans — with the documentation each funder requires.
- Stage gates. Money released in tranches against evidence, not against plans.
- Vendor governance. Enterprise agreements with security and performance KPIs built in.
- Benefits tracking. Savings and outcomes tracked after go-live, when most programmes stop measuring.
Where it was applied
- BRD — Groupe Société Générale · 2011 – 2013Cost Efficiency Programme — >€5M / year savings, target exceeded by 11%; IT budgeting above €40M.
- UN HQ / OICT · 2016 – 2019Enterprise agreements with Microsoft and AWS embedding security and performance KPIs — ~20% annual cost optimisation.
- IBM · 2008 – 201125+ projects a cumulative 9 months ahead of plan, saving €3.72M.
- Motorola · 2006 – 2008CMMI Level III and a 120+ resource PMO — US$2.93M IT savings, 9.88% below budget.
- Multi-country · 2024 – PresentTechnical inputs for World Bank and other IFI operations — ToR, Aide-Mémoire, technical annexes.
Where programmes usually go wrong
- Approving the build without funding the run.
- Business cases that compare one option with doing nothing.
- Benefits owned by nobody once the project closes.
- Contracts without measurable service and security levels.
Questions worth asking before you fund it
- What is the five-year TCO, and who carries it after go-live?
- Which tranche can be stopped if the evidence is not there?
- Who owns each benefit, and when will it be measured?
- What does exit from the main vendor cost?